ocnBgchem: 2D#
2D ocnBgchem data
coordinate(s):
tavg-ols-hxy-sea
tavg-u-hxy-sea
tmax-op20bar-hxy-sea
tavg-d100m-hxy-sea
tavg-d1000m-hxy-sea
tavg: time average
u: ocean surface
ols: ocean surface
op20bar: 20.2bar depth
d100m: layer at 100m depth
d1000m: layer at 1000m depth
hxy: horizontal curvlinear grids
sea: ocean domain
# Parameters
cmorout = "/scratch/yanchun/cmorout"
source_id = "UKESM1-0-LL"
experiment_id = "piControl"
variant_label = "r1i1p1f1"
grid_label = "g99"
version = "v20260709"
List of datasets:
(datasets which are not presented/cmorized have no link.)
ocnBgchem.dissi13c.tavg-ols-hxy-sea.mon.glb
ocnBgchem.fg13co2.tavg-u-hxy-sea.mon.glb
Datasets validated:
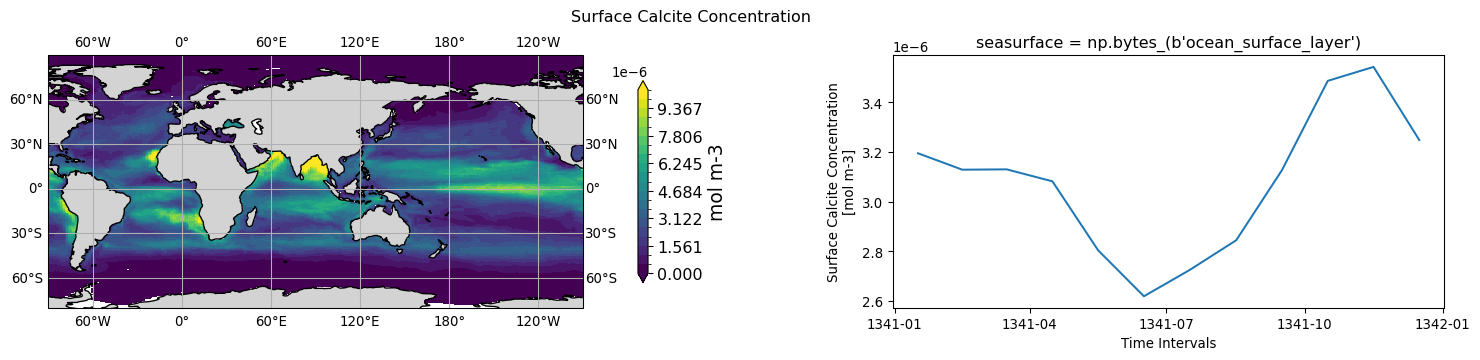
ocnBgchem.calc.tavg-ols-hxy-sea.mon.glb
long name: Surface Calcite Concentration (mol m-3)
timeseries aggregation method for 2D->1D plot: mean
original_name: calclvl -> calc
history: calc = calclvl[:,:,1] 2026-08-04T11:36:47Z altered by CMOR: Treated scalar dimension: 'seasurface'.
ocnBgchem.chl.tavg-ols-hxy-sea.day.glb
long name: Surface Mass Concentration of Total Phytoplankton Expressed as Chlorophyll in Sea Water (kg m-3)
timeseries aggregation method for 2D->1D plot: mean
original_name: srfphyc -> chl
history: chl = srfphyc*122*12/60/1000 2026-08-03T15:22:59Z altered by CMOR: Treated scalar dimension: 'seasurface'.
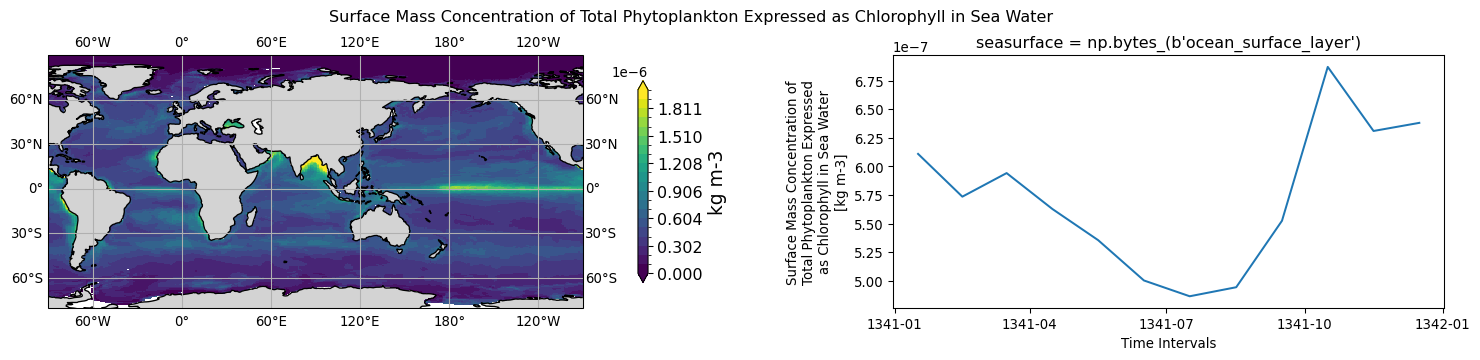
ocnBgchem.chl.tavg-ols-hxy-sea.mon.glb
long name: Surface Mass Concentration of Total Phytoplankton Expressed as Chlorophyll in Sea Water (kg m-3)
timeseries aggregation method for 2D->1D plot: mean
original_name: srfphyc -> chl
history: chl = srfphyc*122*12/60/1000 2026-08-03T15:22:59Z altered by CMOR: Treated scalar dimension: 'seasurface'.
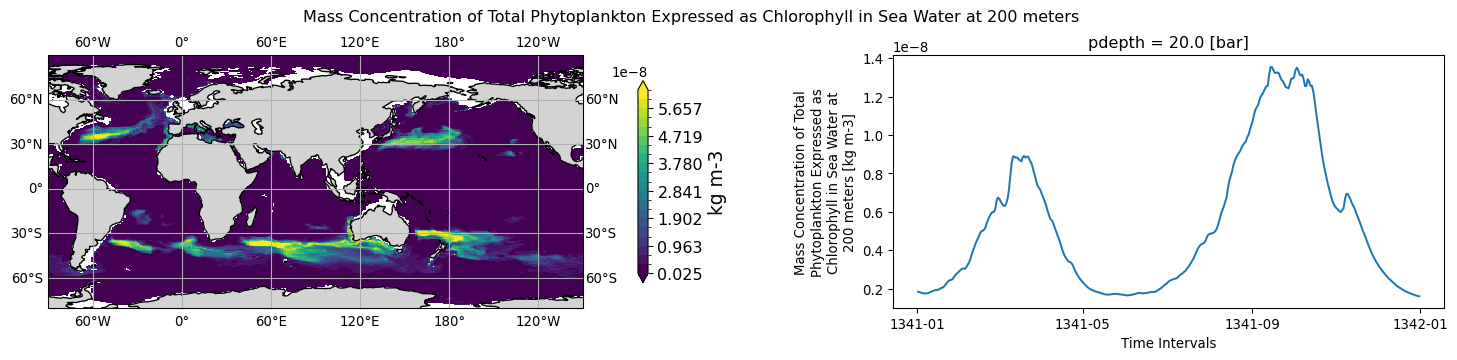
ocnBgchem.chl.tavg-op20bar-hxy-sea.day.glb
long name: Mass Concentration of Total Phytoplankton Expressed as Chlorophyll in Sea Water at 200 meters (kg m-3)
timeseries aggregation method for 2D->1D plot: mean
original_name: phyc_200 -> chl
history: chl = phy_200*122*12/60/1000 2026-08-03T15:23:00Z altered by CMOR: Treated scalar dimension: 'pdepth'.
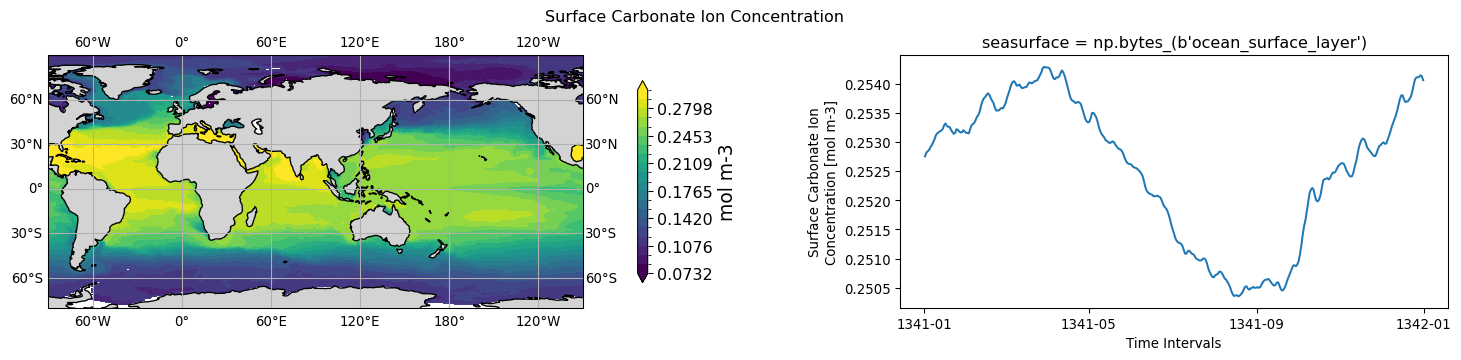
ocnBgchem.co3.tavg-ols-hxy-sea.day.glb
long name: Surface Carbonate Ion Concentration (mol m-3)
timeseries aggregation method for 2D->1D plot: mean
original_name: srfco3 -> co3
history: 2026-08-03T15:23:18Z altered by CMOR: Treated scalar dimension: 'seasurface'.
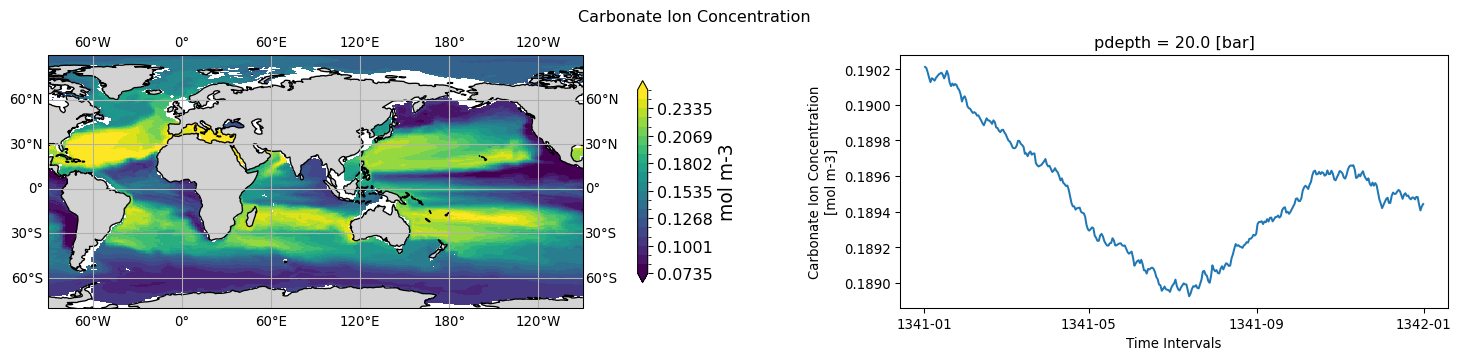
ocnBgchem.co3.tavg-op20bar-hxy-sea.day.glb
long name: Carbonate Ion Concentration (mol m-3)
timeseries aggregation method for 2D->1D plot: mean
original_name: co3_200 -> co3
history: 2026-08-04T11:19:53Z altered by CMOR: Treated scalar dimension: 'pdepth'.
ocnBgchem.co3satarag.tavg-ols-hxy-sea.day.glb
long name: Surface Mole Concentration of Carbonate Ion in Equilibrium with Pure Aragonite in Sea Water (mol m-3)
timeseries aggregation method for 2D->1D plot: mean
original_name: srfco3satarag -> co3satarag
history: 2026-08-03T15:23:36Z altered by CMOR: Treated scalar dimension: 'seasurface'.
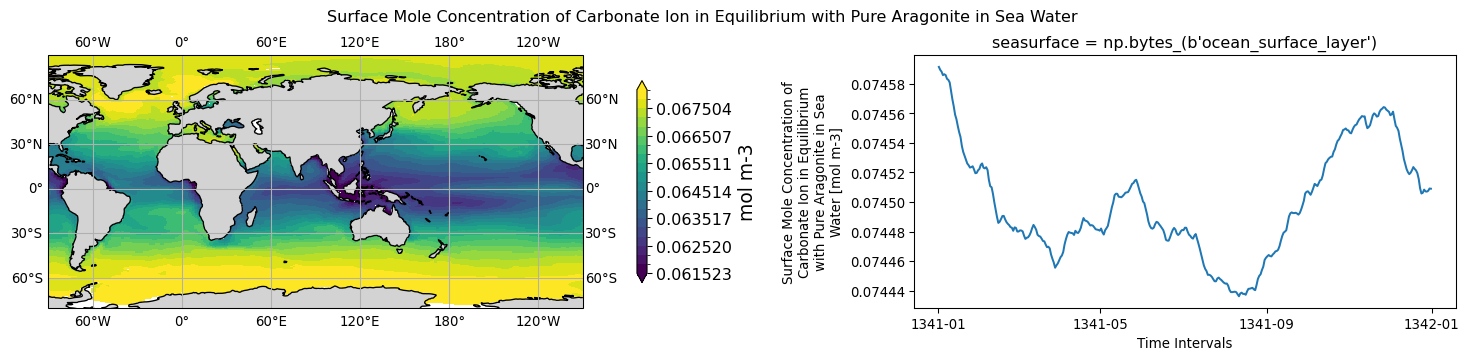
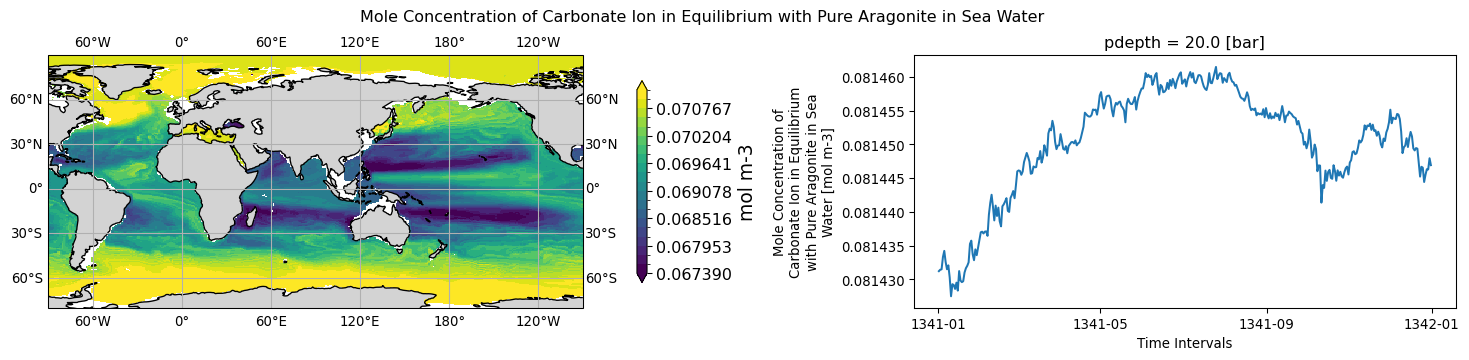
ocnBgchem.co3satarag.tavg-op20bar-hxy-sea.day.glb
long name: Mole Concentration of Carbonate Ion in Equilibrium with Pure Aragonite in Sea Water (mol m-3)
timeseries aggregation method for 2D->1D plot: mean
original_name: co3satarag_200 -> co3satarag
history: 2026-08-03T15:23:52Z altered by CMOR: Treated scalar dimension: 'pdepth'.
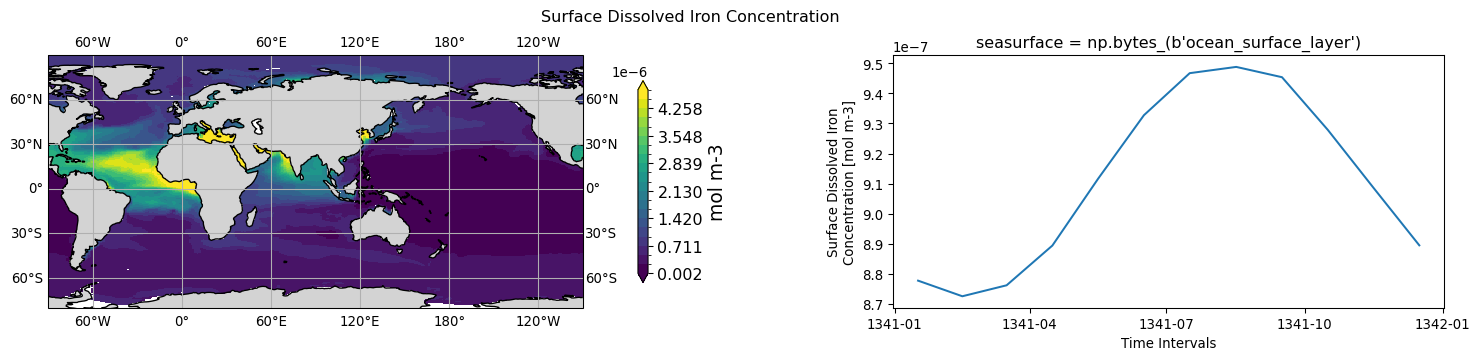
ocnBgchem.dfe.tavg-ols-hxy-sea.mon.glb
long name: Surface Dissolved Iron Concentration (mol m-3)
timeseries aggregation method for 2D->1D plot: mean
original_name: srfdfe -> dfe
history: 2026-08-03T15:24:05Z altered by CMOR: Treated scalar dimension: 'seasurface'.
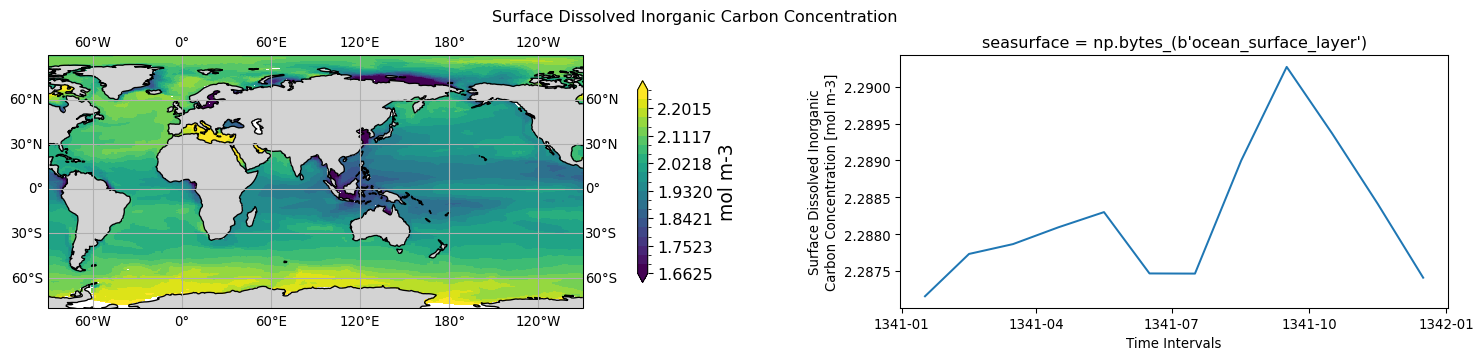
ocnBgchem.dissic.tavg-ols-hxy-sea.mon.30S-90S
long name: Surface Dissolved Inorganic Carbon Concentration (mol m-3)
timeseries aggregation method for 2D->1D plot: mean
original_name: srfdissic -> dissic
history: 2026-08-03T15:24:06Z altered by CMOR: Treated scalar dimension: 'seasurface'.
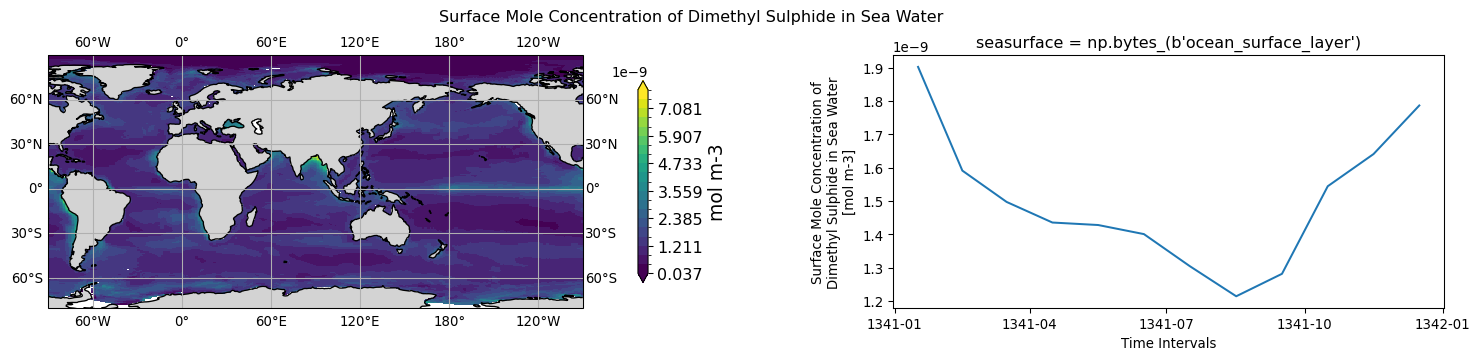
ocnBgchem.dmso.tavg-ols-hxy-sea.mon.glb
long name: Surface Mole Concentration of Dimethyl Sulphide in Sea Water (mol m-3)
timeseries aggregation method for 2D->1D plot: mean
original_name: dms -> dmso
history: 2026-08-03T15:24:07Z altered by CMOR: Treated scalar dimension: 'seasurface'.
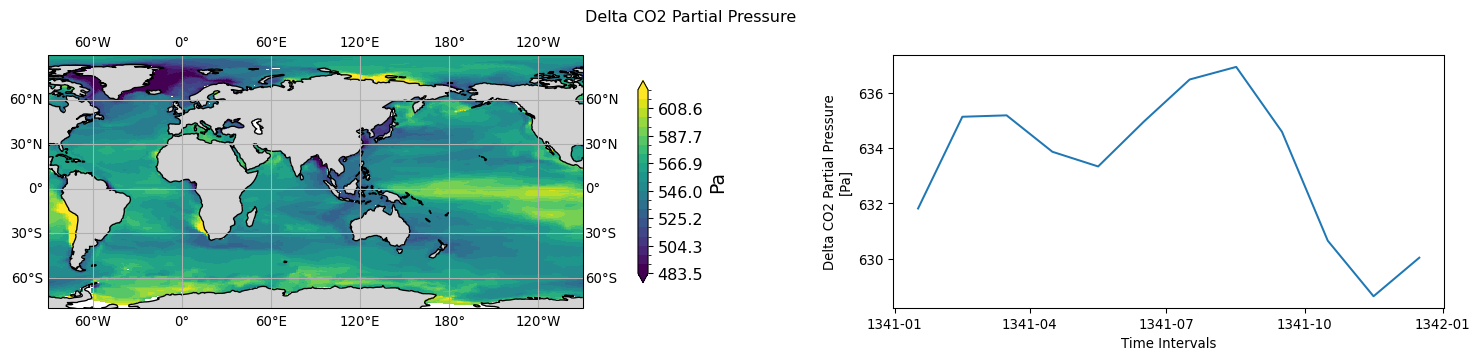
ocnBgchem.dpco2.tavg-u-hxy-sea.mon.glb
long name: Delta CO2 Partial Pressure (Pa)
timeseries aggregation method for 2D->1D plot: mean
original_name: pco2, pco2_gex -> dpco2
history: dpco2 = (pco2-pco2_gex)*muatm2pa
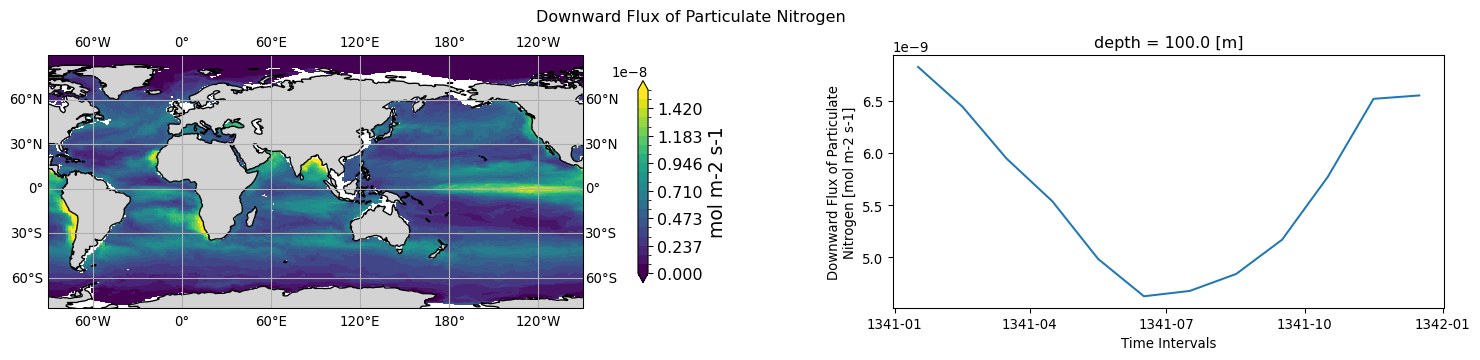
ocnBgchem.epn.tavg-d100m-hxy-sea.mon.glb
long name: Downward Flux of Particulate Nitrogen (mol m-2 s-1)
timeseries aggregation method for 2D->1D plot: mean
original_name: carflx0100 -> epn
history: epn = carflx0100/122*16 2026-07-09T01:29:59Z altered by CMOR: Treated scalar dimension: 'depth'.
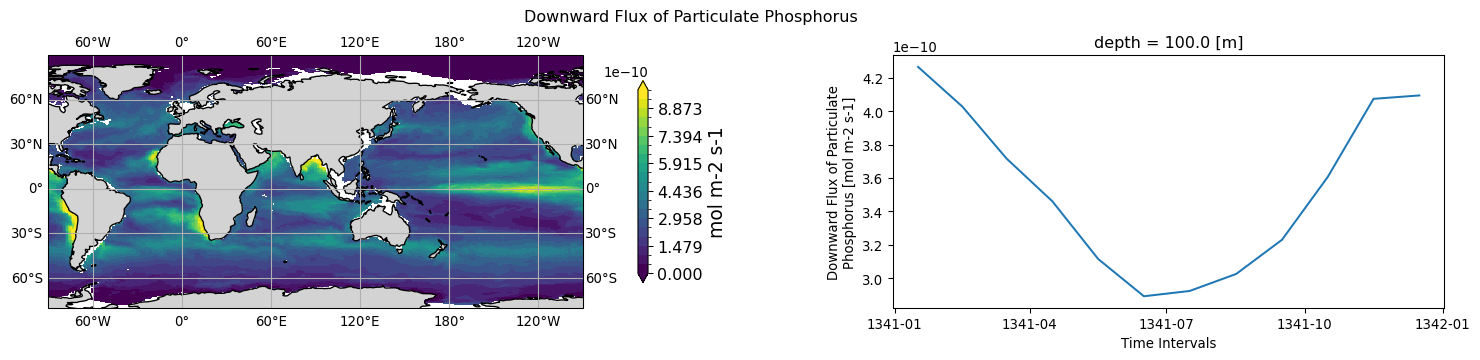
ocnBgchem.epp.tavg-d100m-hxy-sea.mon.glb
long name: Downward Flux of Particulate Phosphorus (mol m-2 s-1)
timeseries aggregation method for 2D->1D plot: mean
original_name: carflx0100 -> epp
history: epp = carflx0100/122 2026-07-09T01:30:00Z altered by CMOR: Treated scalar dimension: 'depth'.
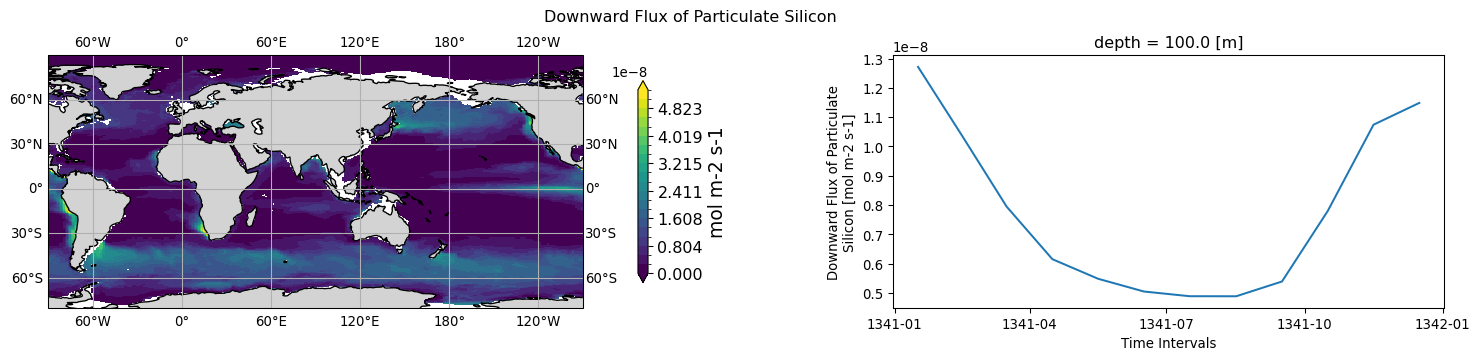
ocnBgchem.epsi.tavg-d100m-hxy-sea.mon.glb
long name: Downward Flux of Particulate Silicon (mol m-2 s-1)
timeseries aggregation method for 2D->1D plot: mean
original_name: bsiflx0100 -> epsi
history: 2026-07-09T01:30:01Z altered by CMOR: Treated scalar dimension: 'depth'.
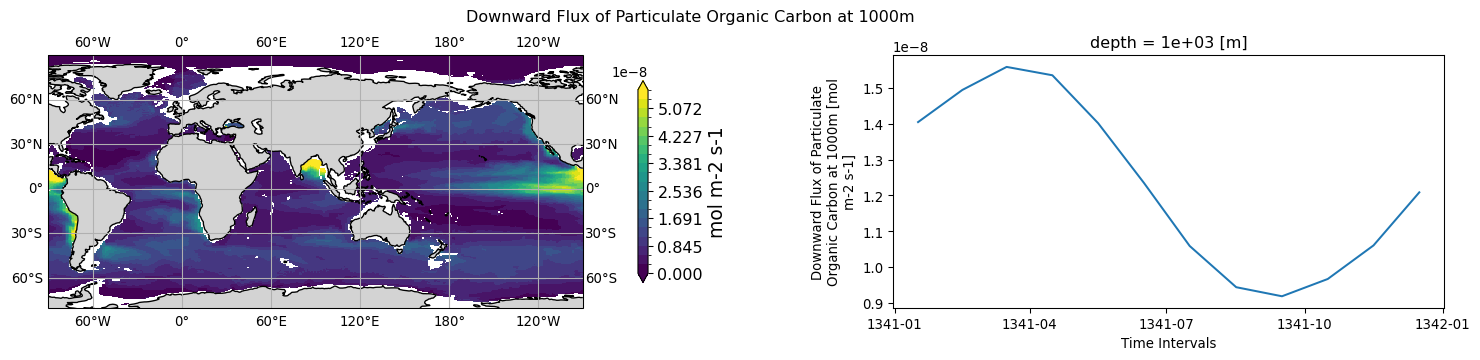
ocnBgchem.expc.tavg-d1000m-hxy-sea.mon.glb
long name: Downward Flux of Particulate Organic Carbon at 1000m (mol m-2 s-1)
timeseries aggregation method for 2D->1D plot: mean
original_name: carflx1000 -> expc
history: 2026-07-09T01:30:01Z altered by CMOR: Treated scalar dimension: 'depth'.
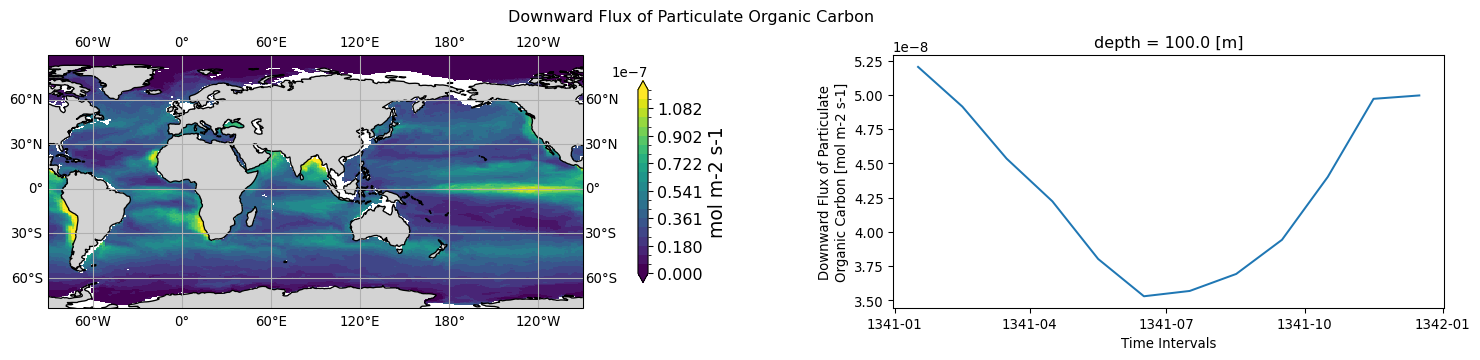
ocnBgchem.expc.tavg-d100m-hxy-sea.mon.glb
long name: Downward Flux of Particulate Organic Carbon (mol m-2 s-1)
timeseries aggregation method for 2D->1D plot: mean
original_name: carflx0100 -> expc
history: 2026-07-09T01:30:02Z altered by CMOR: Treated scalar dimension: 'depth'.
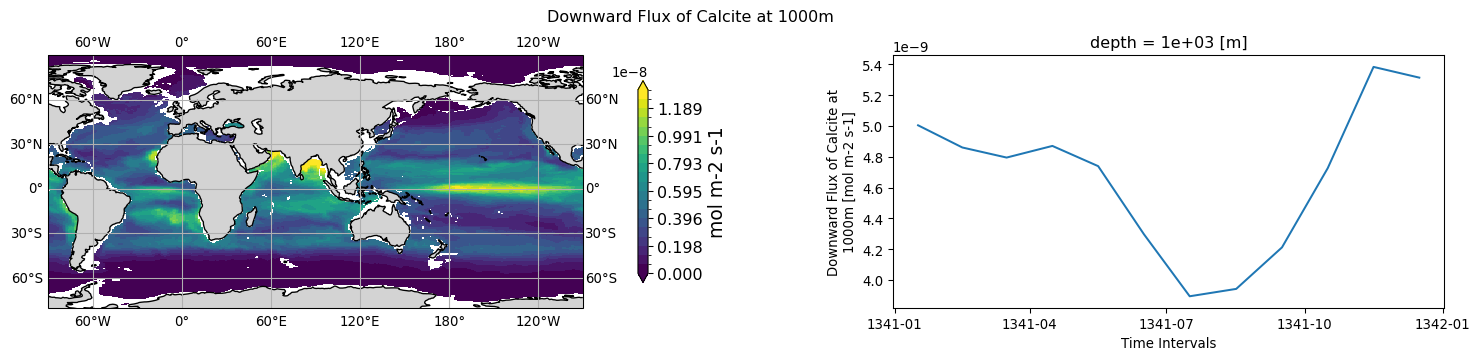
ocnBgchem.expcalc.tavg-d1000m-hxy-sea.mon.glb
long name: Downward Flux of Calcite at 1000m (mol m-2 s-1)
timeseries aggregation method for 2D->1D plot: mean
original_name: calflx1000 -> expcalc
history: 2026-07-09T01:30:03Z altered by CMOR: Treated scalar dimension: 'depth'.
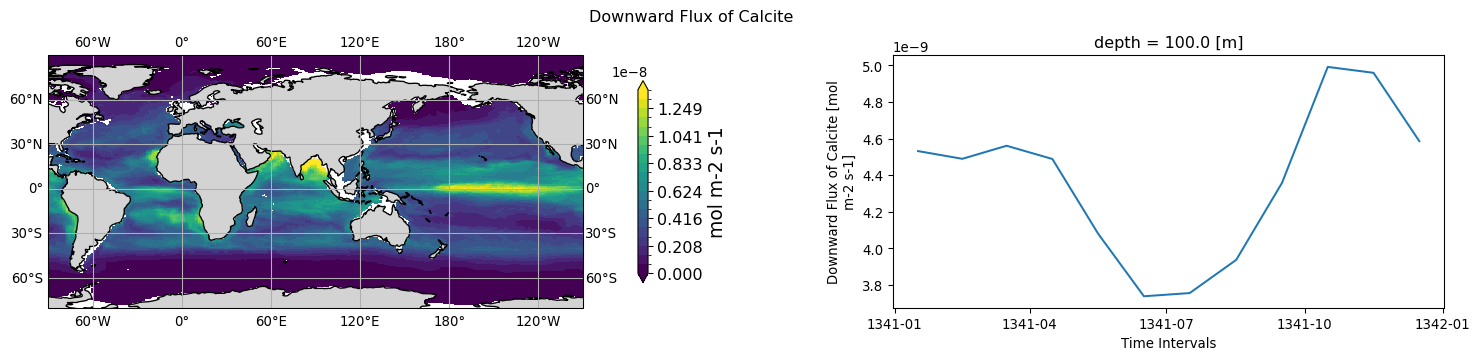
ocnBgchem.expcalc.tavg-d100m-hxy-sea.mon.glb
long name: Downward Flux of Calcite (mol m-2 s-1)
timeseries aggregation method for 2D->1D plot: mean
original_name: calflx0100 -> expcalc
history: 2026-07-09T01:30:03Z altered by CMOR: Treated scalar dimension: 'depth'.
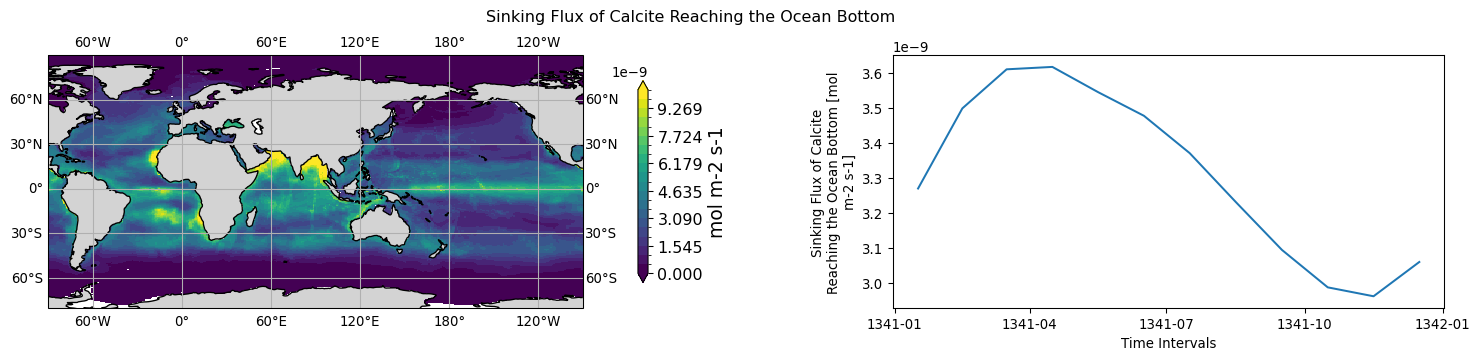
ocnBgchem.expcalcob.tavg-u-hxy-sea.mon.glb
long name: Sinking Flux of Calcite Reaching the Ocean Bottom (mol m-2 s-1)
timeseries aggregation method for 2D->1D plot: mean
original_name: calflx_bot -> expcalcob
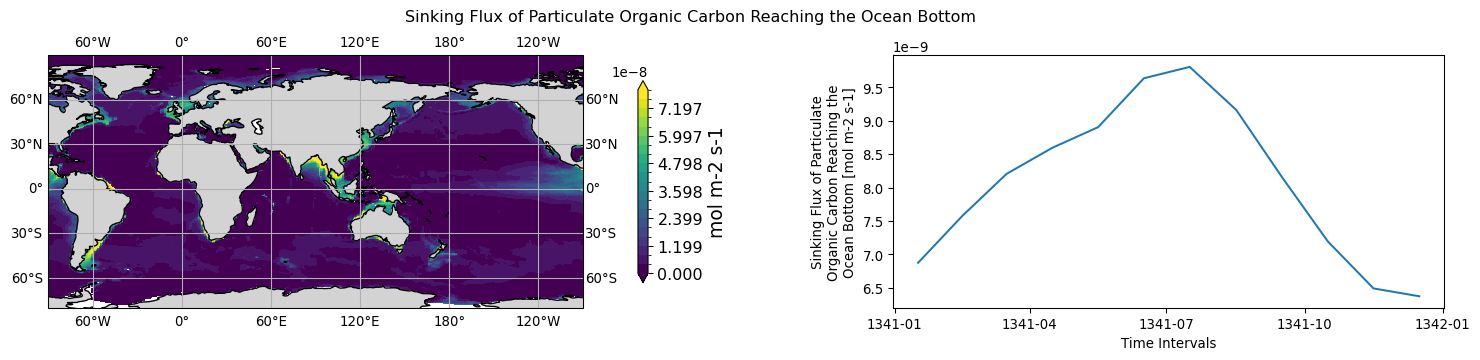
ocnBgchem.expcob.tavg-u-hxy-sea.mon.glb
long name: Sinking Flux of Particulate Organic Carbon Reaching the Ocean Bottom (mol m-2 s-1)
timeseries aggregation method for 2D->1D plot: mean
original_name: carflx_bot -> expcob
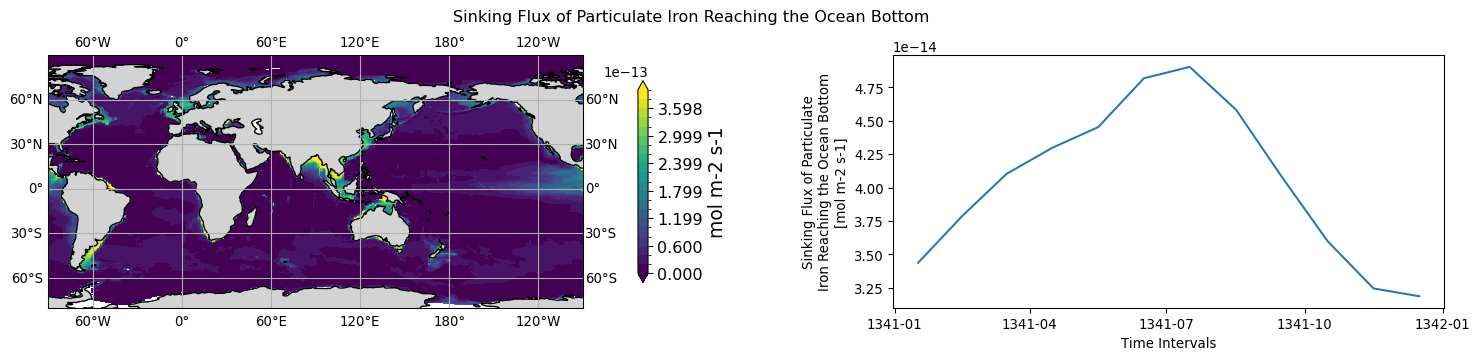
ocnBgchem.expfeob.tavg-u-hxy-sea.mon.glb
long name: Sinking Flux of Particulate Iron Reaching the Ocean Bottom (mol m-2 s-1)
timeseries aggregation method for 2D->1D plot: mean
original_name: carflx_bot -> expfeob
history: expfeob = carflx_bot*5.*1.e-6
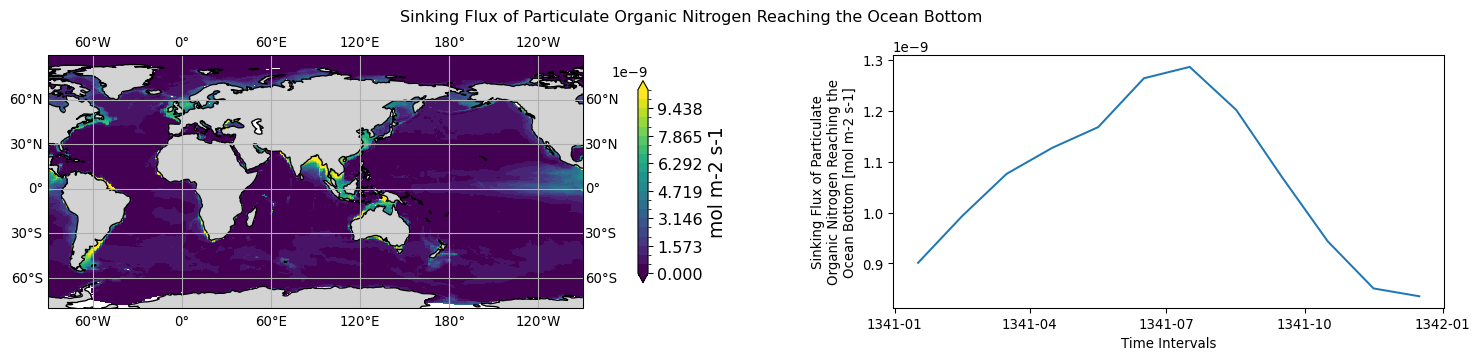
ocnBgchem.expnob.tavg-u-hxy-sea.mon.glb
long name: Sinking Flux of Particulate Organic Nitrogen Reaching the Ocean Bottom (mol m-2 s-1)
timeseries aggregation method for 2D->1D plot: mean
original_name: carflx_bot -> expnob
history: expnob = carflx_bot/122*16
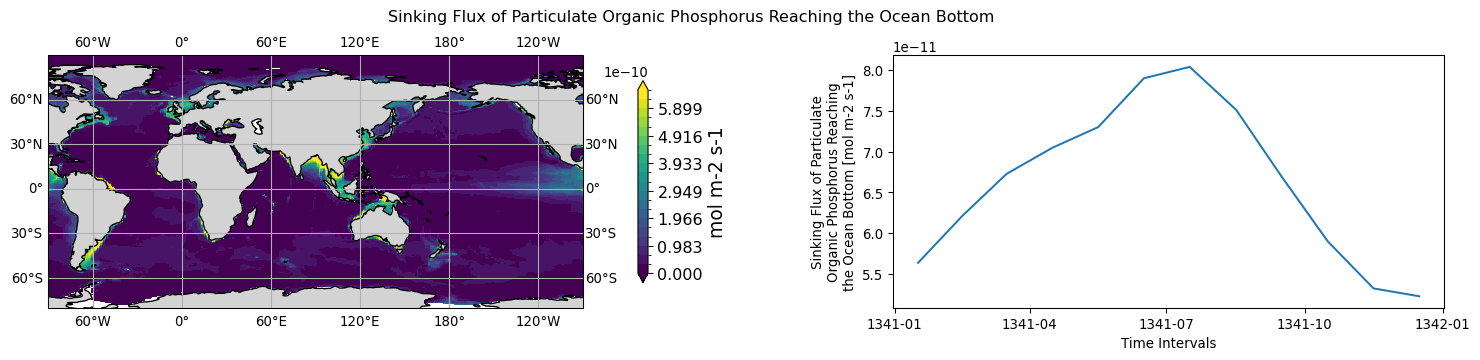
ocnBgchem.exppob.tavg-u-hxy-sea.mon.glb
long name: Sinking Flux of Particulate Organic Phosphorus Reaching the Ocean Bottom (mol m-2 s-1)
timeseries aggregation method for 2D->1D plot: mean
original_name: carflx_bot -> exppob
history: exppob = carflx_bot/122
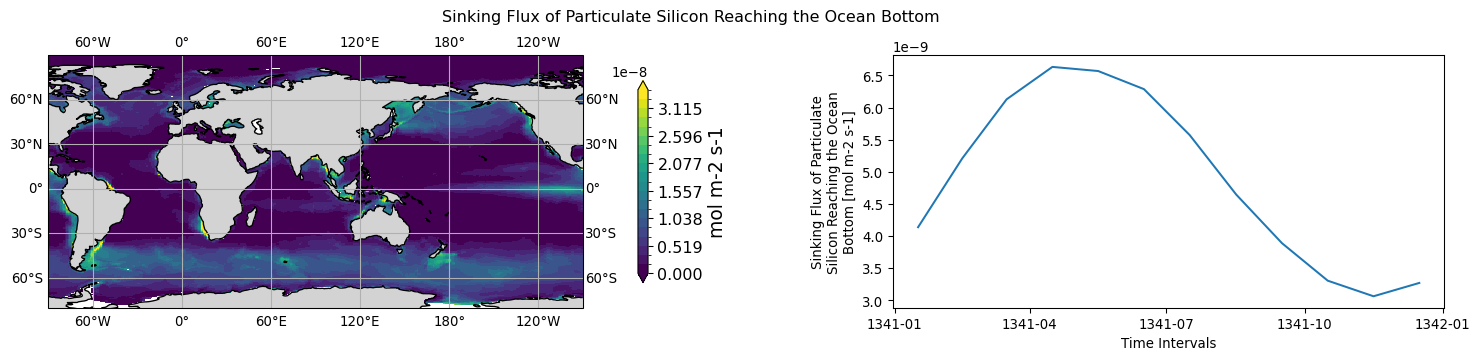
ocnBgchem.expsiob.tavg-u-hxy-sea.mon.glb
long name: Sinking Flux of Particulate Silicon Reaching the Ocean Bottom (mol m-2 s-1)
timeseries aggregation method for 2D->1D plot: mean
original_name: bsiflx_bot -> expsiob
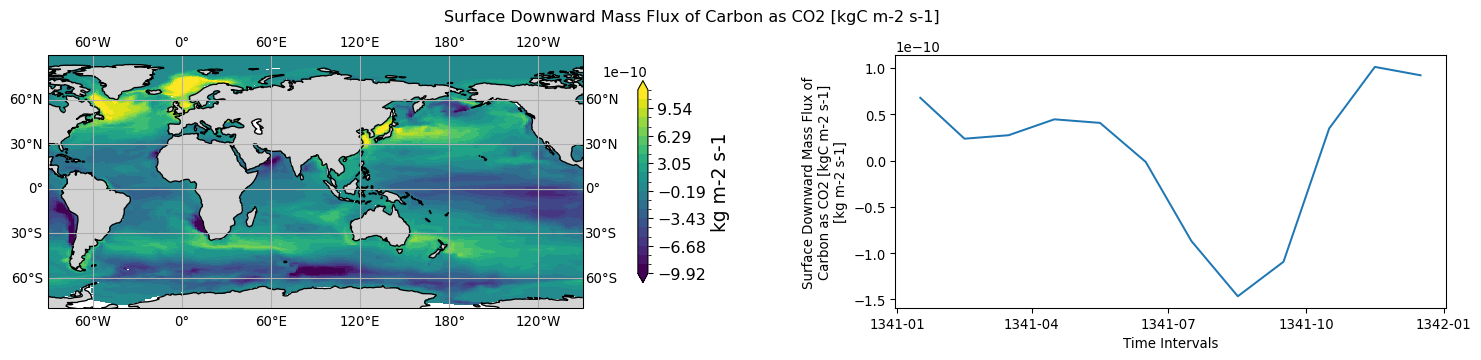
ocnBgchem.fgco2.tavg-u-hxy-sea.mon.glb
long name: Surface Downward Mass Flux of Carbon as CO2 [kgC m-2 s-1] (kg m-2 s-1)
timeseries aggregation method for 2D->1D plot: mean
original_name: co2fxd, co2fxu -> fgco2
history: fgco2 = co2fxd-co2fxu
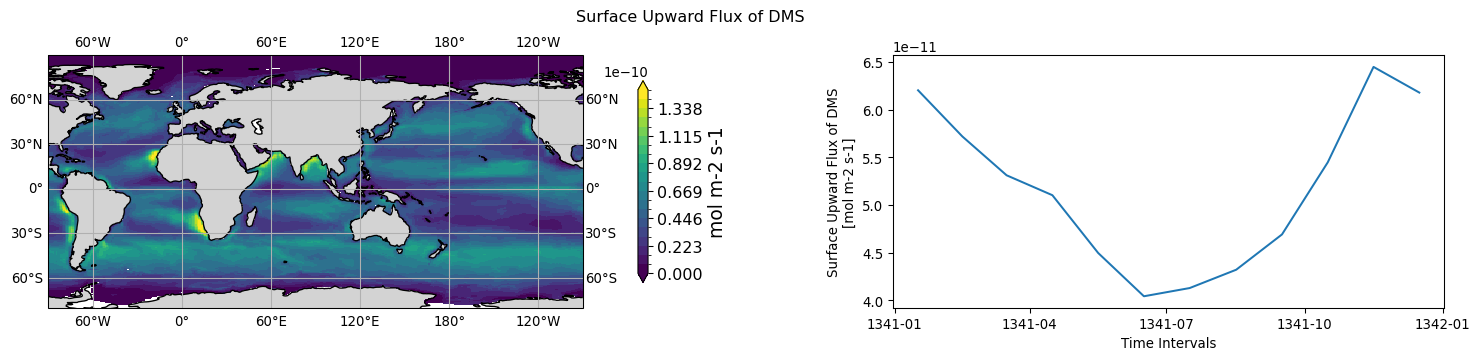
ocnBgchem.fgdms.tavg-u-hxy-sea.mon.glb
long name: Surface Upward Flux of DMS (mol m-2 s-1)
timeseries aggregation method for 2D->1D plot: mean
original_name: dmsflux -> fgdms
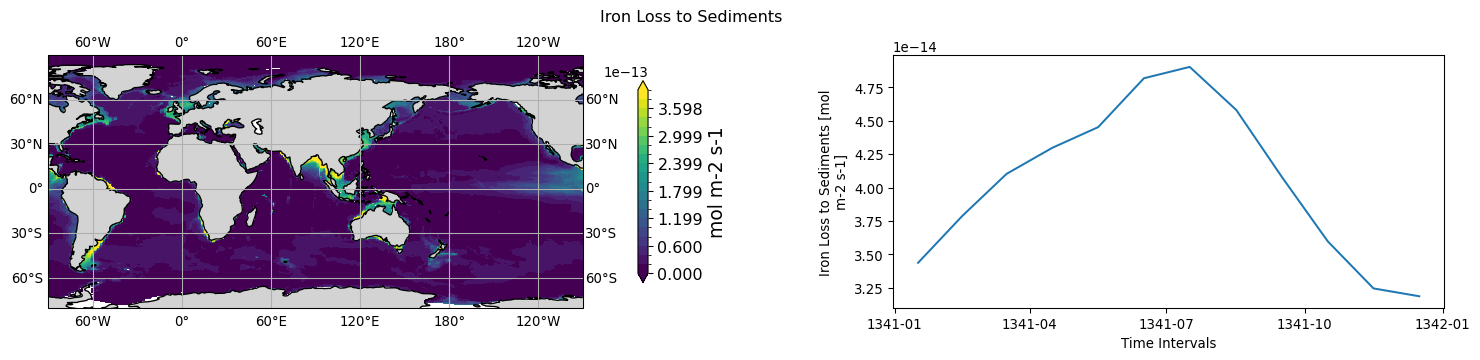
ocnBgchem.frfe.tavg-u-hxy-sea.mon.glb
long name: Iron Loss to Sediments (mol m-2 s-1)
timeseries aggregation method for 2D->1D plot: mean
original_name: carflx_bot -> frfe
history: frfe = carflx_bot*5.*1.e-6
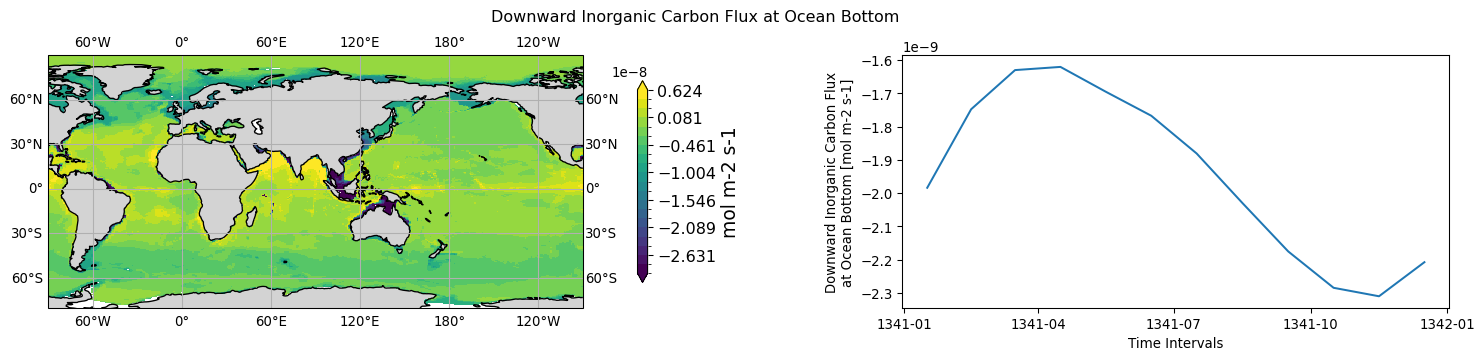
ocnBgchem.fric.tavg-u-hxy-sea.mon.glb
long name: Downward Inorganic Carbon Flux at Ocean Bottom (mol m-2 s-1)
timeseries aggregation method for 2D->1D plot: mean
original_name: calflx_bot, sedfdic -> fric
history: fric = calflx_bot+sedfdic
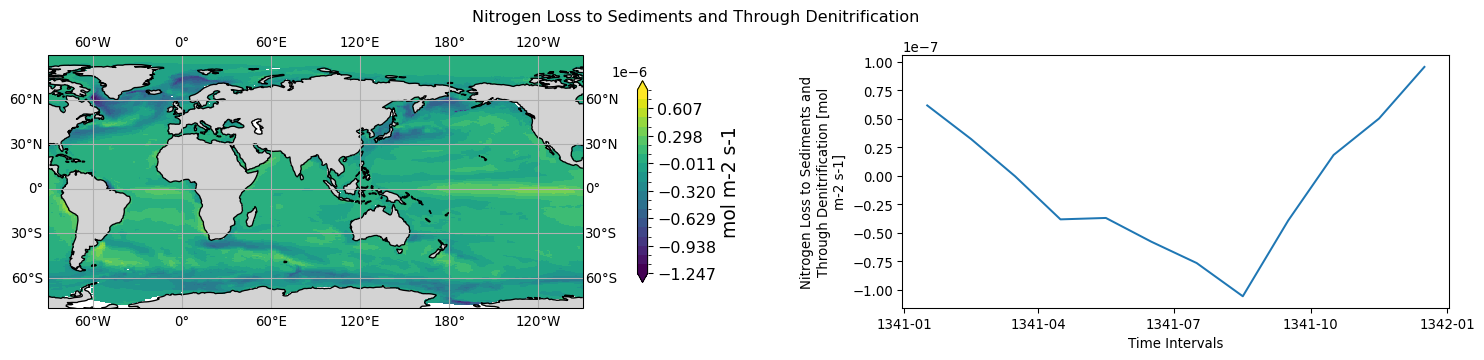
ocnBgchem.frn.tavg-u-hxy-sea.mon.glb
long name: Nitrogen Loss to Sediments and Through Denitrification (mol m-2 s-1)
timeseries aggregation method for 2D->1D plot: mean
original_name: ndepnoy, ndepnhx, 2*fgn2, 2*n2oflux, nh3flux -> frn
history: frn = ndepnoy+ndepnhx-2*fgn2-2*n2oflux-nh3flux
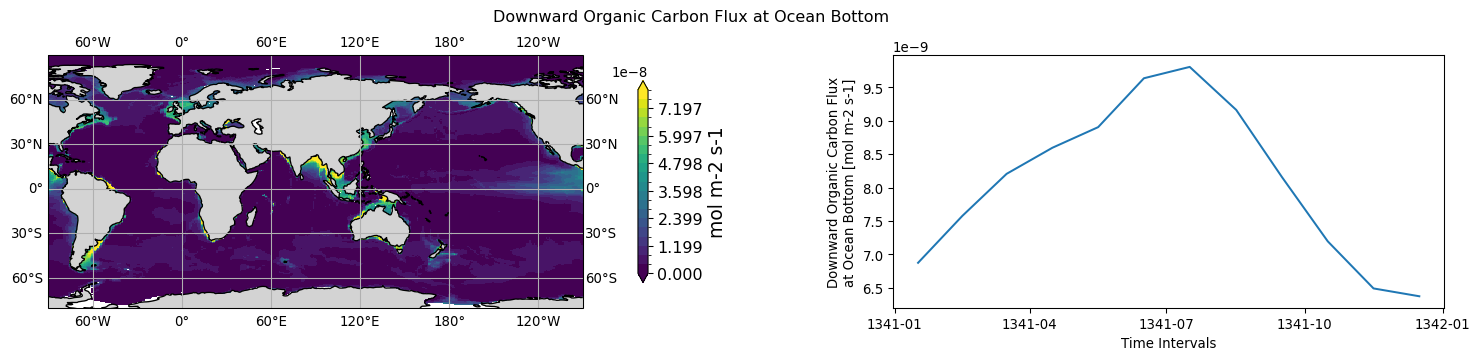
ocnBgchem.froc.tavg-u-hxy-sea.mon.glb
long name: Downward Organic Carbon Flux at Ocean Bottom (mol m-2 s-1)
timeseries aggregation method for 2D->1D plot: mean
original_name: carflx_bot -> froc
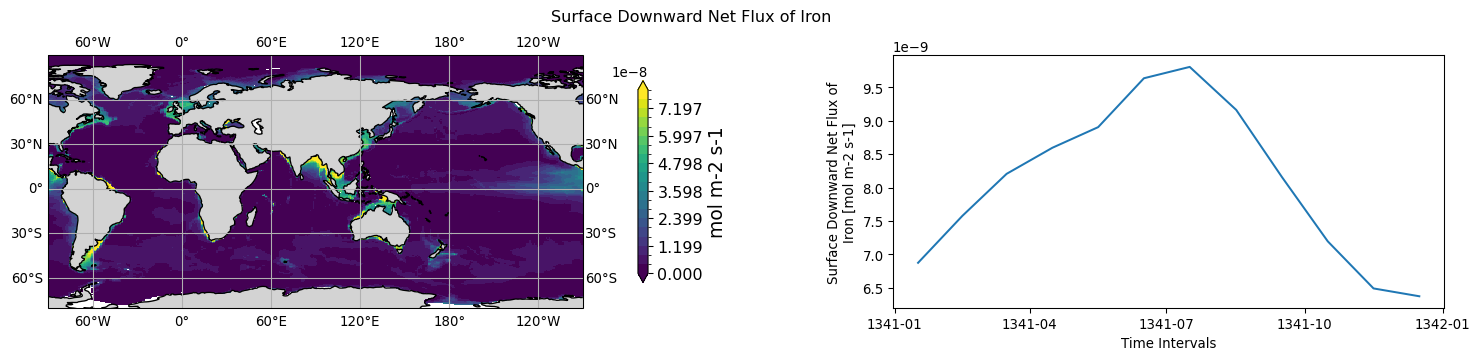
ocnBgchem.fsfe.tavg-u-hxy-sea.mon.glb
long name: Surface Downward Net Flux of Iron (mol m-2 s-1)
timeseries aggregation method for 2D->1D plot: mean
original_name: carflx_bot -> fsfe
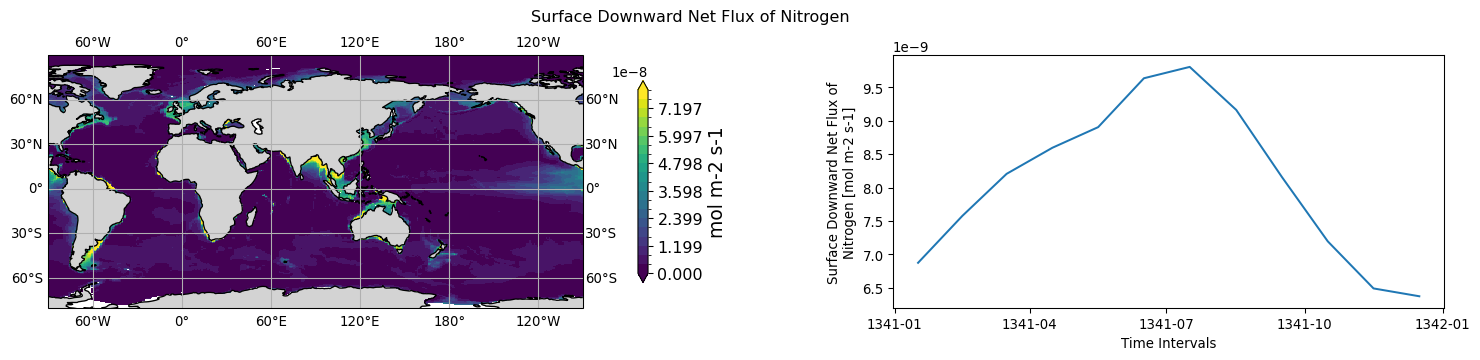
ocnBgchem.fsn.tavg-u-hxy-sea.mon.glb
long name: Surface Downward Net Flux of Nitrogen (mol m-2 s-1)
timeseries aggregation method for 2D->1D plot: mean
original_name: carflx_bot -> fsn
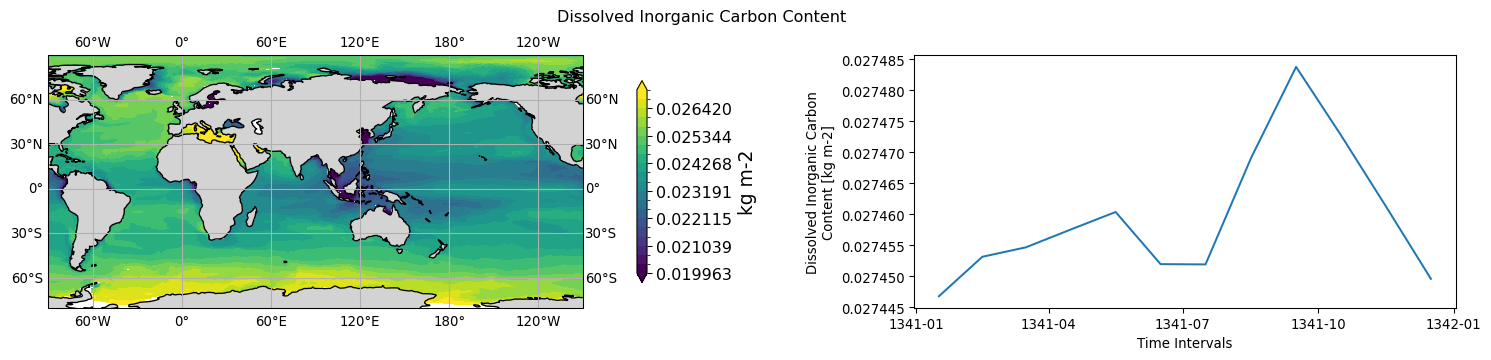
ocnBgchem.intdic.tavg-u-hxy-sea.mon.30S-90S
long name: Dissolved Inorganic Carbon Content (kg m-2)
timeseries aggregation method for 2D->1D plot: mean
original_name: dissiclvl) -> intdic
history: intdic = int(dissiclvl*12/1000)_z
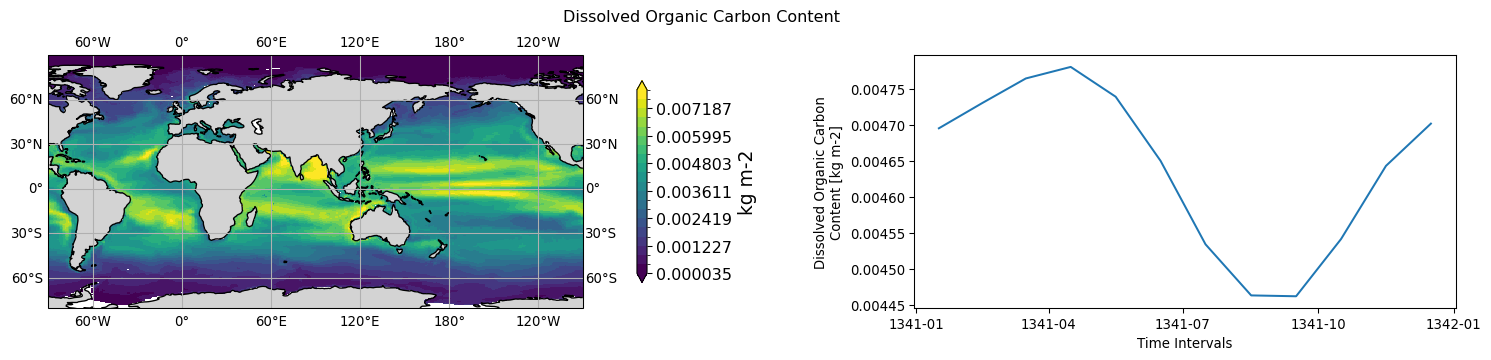
ocnBgchem.intdoc.tavg-u-hxy-sea.mon.30S-90S
long name: Dissolved Organic Carbon Content (kg m-2)
timeseries aggregation method for 2D->1D plot: mean
original_name: dissoclvl -> intdoc
history: intdoc [kg C m-2] = sum_z(dissoclvl[mol P m-2]*122*12/1000)
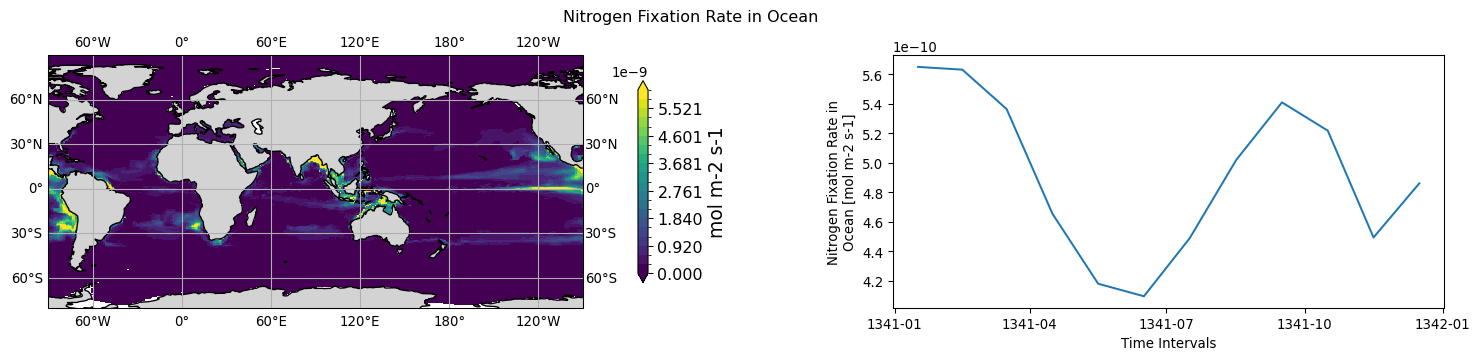
ocnBgchem.intpn2.tavg-u-hxy-sea.mon.30S-90S
long name: Nitrogen Fixation Rate in Ocean (mol m-2 s-1)
timeseries aggregation method for 2D->1D plot: mean
original_name: nfixint -> intpn2
ocnBgchem.intpoc.tavg-u-hxy-sea.day.glb
long name: Particulate Organic Carbon Content (kg m-2)
timeseries aggregation method for 2D->1D plot: mean
original_name: intpoc -> intpoc
history: intpoc[kg C m-2] = intpoc[mol P m-2]*122*12/1000
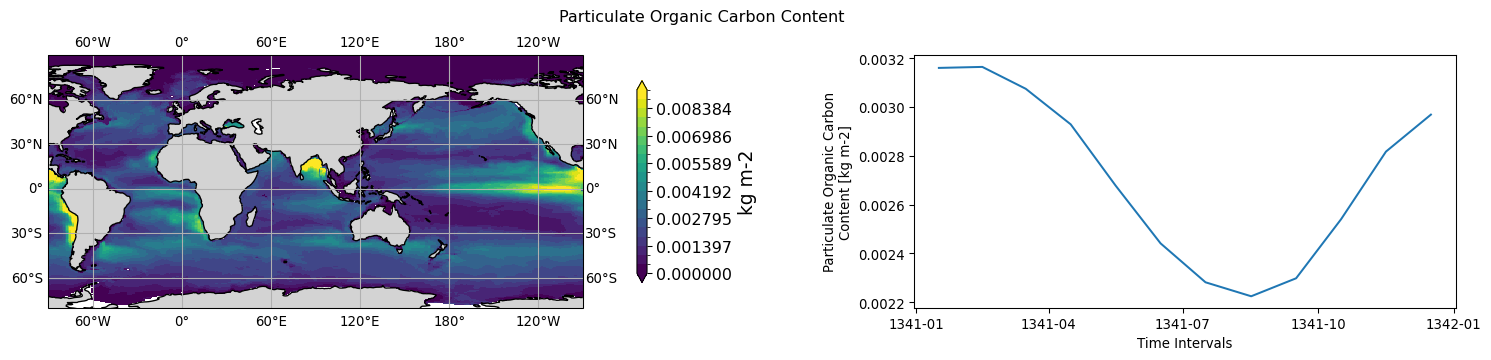
ocnBgchem.intpoc.tavg-u-hxy-sea.mon.30S-90S
long name: Particulate Organic Carbon Content (kg m-2)
timeseries aggregation method for 2D->1D plot: mean
original_name: intpoc -> intpoc
history: intpoc[kg C m-2] = intpoc[mol P m-2]*122*12/1000
ocnBgchem.intpp.tavg-u-hxy-sea.day.glb
long name: Primary Organic Carbon Production by All Types of Phytoplankton (mol m-2 s-1)
timeseries aggregation method for 2D->1D plot: mean
original_name: ppint -> intpp
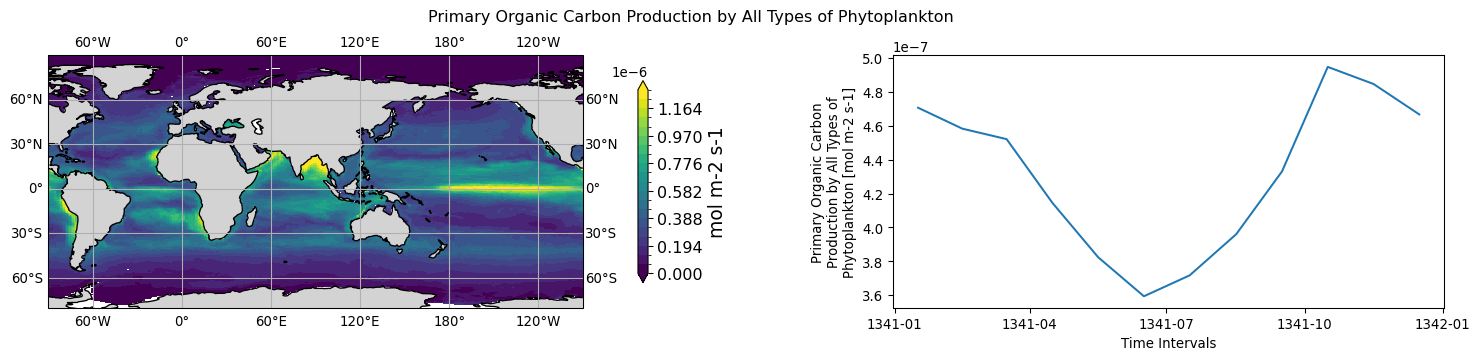
ocnBgchem.intpp.tavg-u-hxy-sea.mon.glb
long name: Primary Organic Carbon Production by All Types of Phytoplankton (mol m-2 s-1)
timeseries aggregation method for 2D->1D plot: mean
original_name: ppint -> intpp
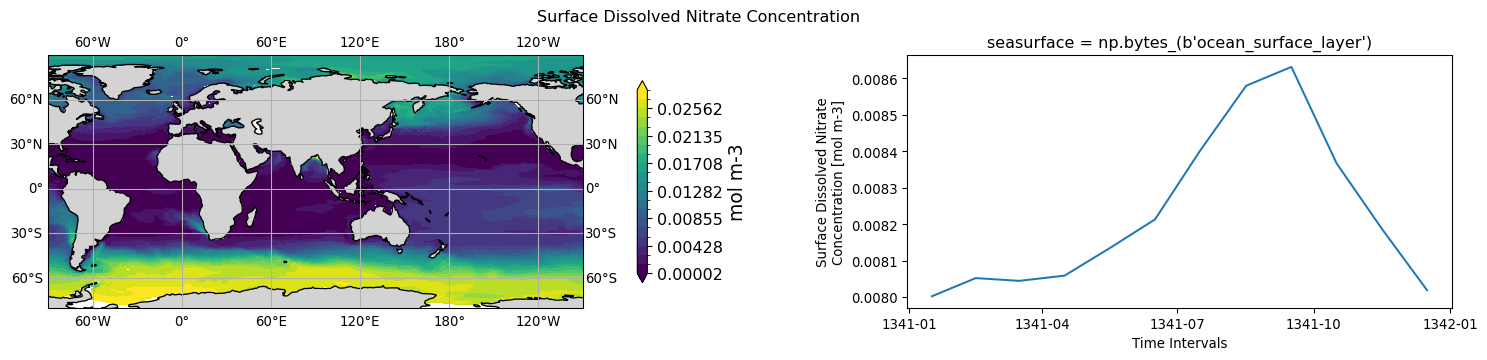
ocnBgchem.no3.tavg-ols-hxy-sea.mon.glb
long name: Surface Dissolved Nitrate Concentration (mol m-3)
timeseries aggregation method for 2D->1D plot: mean
original_name: srfno3 -> no3
history: 2026-08-03T15:24:08Z altered by CMOR: Treated scalar dimension: 'seasurface'.
ocnBgchem.o2.tavg-ols-hxy-sea.day.glb
long name: Surface Dissolved Oxygen Concentration (mol m-3)
timeseries aggregation method for 2D->1D plot: mean
original_name: srfo2 -> o2
history: 2026-08-03T15:24:25Z altered by CMOR: Treated scalar dimension: 'seasurface'.
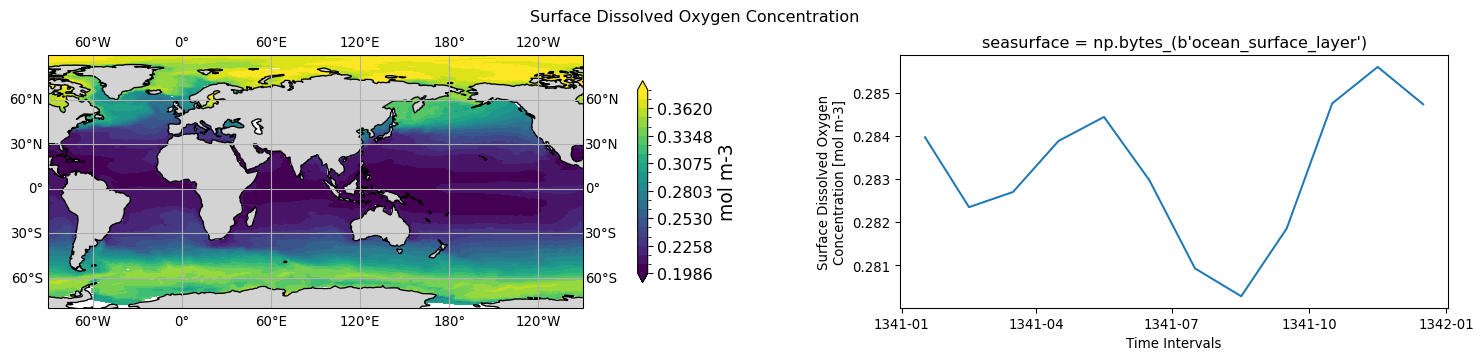
ocnBgchem.o2.tavg-ols-hxy-sea.mon.glb
long name: Surface Dissolved Oxygen Concentration (mol m-3)
timeseries aggregation method for 2D->1D plot: mean
original_name: srfo2 -> o2
history: 2026-08-03T15:24:25Z altered by CMOR: Treated scalar dimension: 'seasurface'.
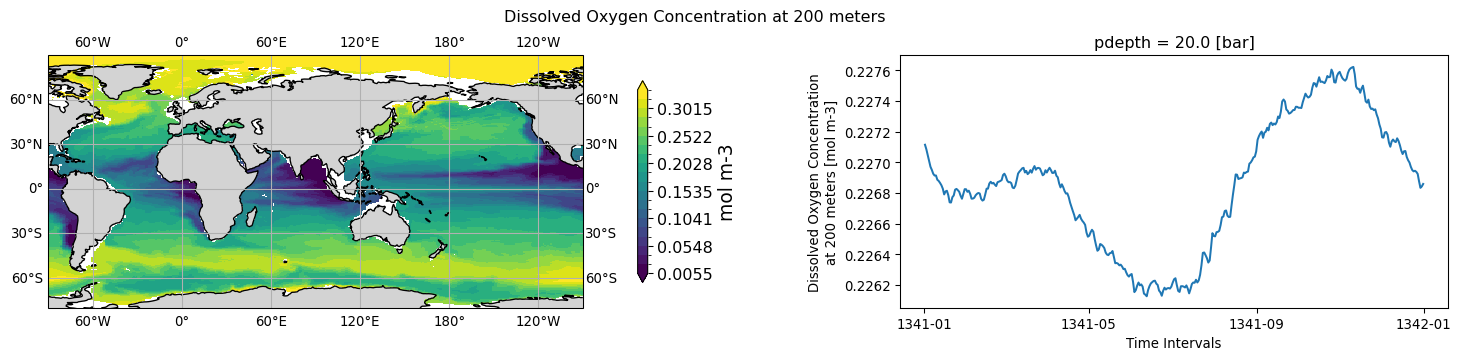
ocnBgchem.o2.tavg-op20bar-hxy-sea.day.glb
long name: Dissolved Oxygen Concentration at 200 meters (mol m-3)
timeseries aggregation method for 2D->1D plot: mean
original_name: o2_200 -> o2
history: 2026-08-03T15:24:25Z altered by CMOR: Treated scalar dimension: 'pdepth'.
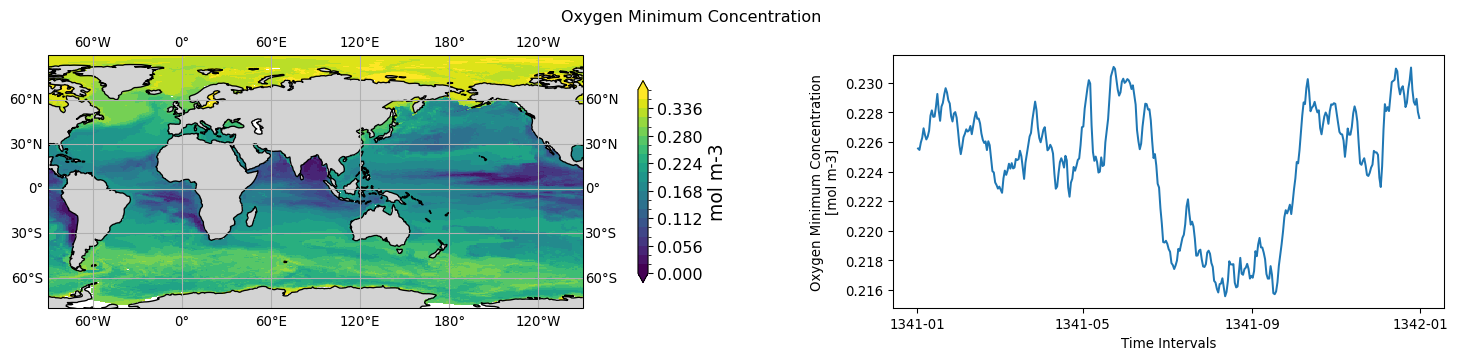
ocnBgchem.o2min.tavg-u-hxy-sea.day.glb
long name: Oxygen Minimum Concentration (mol m-3)
timeseries aggregation method for 2D->1D plot: mean
original_name: o2min -> o2min
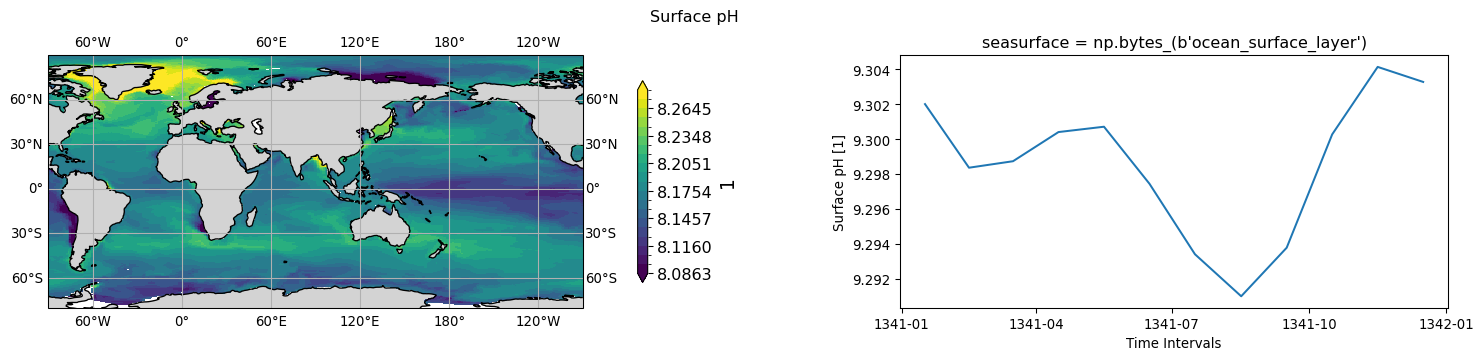
ocnBgchem.ph.tavg-ols-hxy-sea.day.glb
long name: Surface pH (1)
timeseries aggregation method for 2D->1D plot: mean
original_name: srfph -> ph
history: 2026-08-03T15:24:53Z altered by CMOR: Treated scalar dimension: 'seasurface'.
ocnBgchem.ph.tavg-ols-hxy-sea.mon.30S-90S
long name: Surface pH (1)
timeseries aggregation method for 2D->1D plot: mean
original_name: srfph -> ph
history: 2026-08-03T15:24:53Z altered by CMOR: Treated scalar dimension: 'seasurface'.
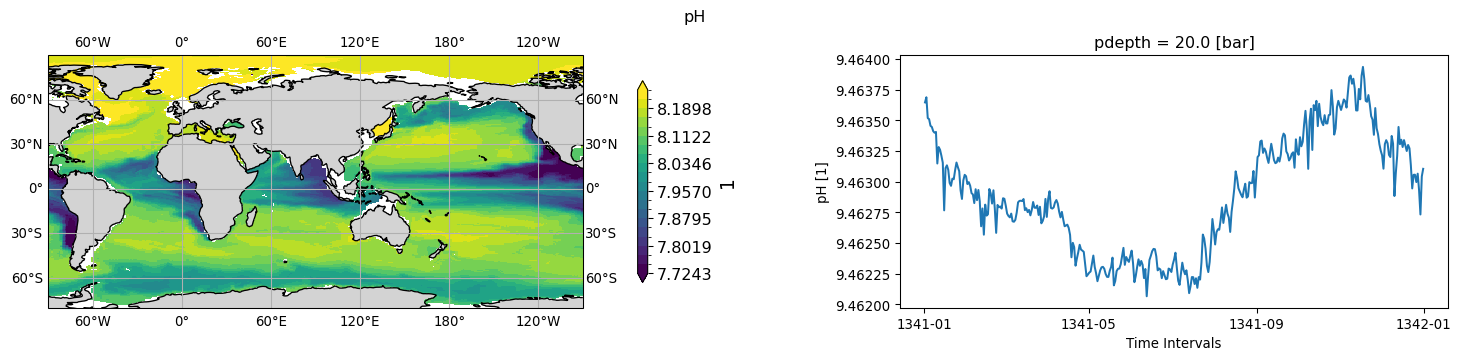
ocnBgchem.ph.tavg-op20bar-hxy-sea.day.glb
long name: pH (1)
timeseries aggregation method for 2D->1D plot: mean
original_name: ph_200 -> ph
history: 2026-08-03T15:24:54Z altered by CMOR: Treated scalar dimension: 'pdepth'.
ocnBgchem.phyc.tavg-ols-hxy-sea.day.glb
long name: Sea Surface Phytoplankton Carbon Concentration (mol m-3)
timeseries aggregation method for 2D->1D plot: mean
original_name: srfphyc -> phyc
history: phyc = srfphyc*122 2026-08-03T15:25:26Z altered by CMOR: Treated scalar dimension: 'seasurface'.
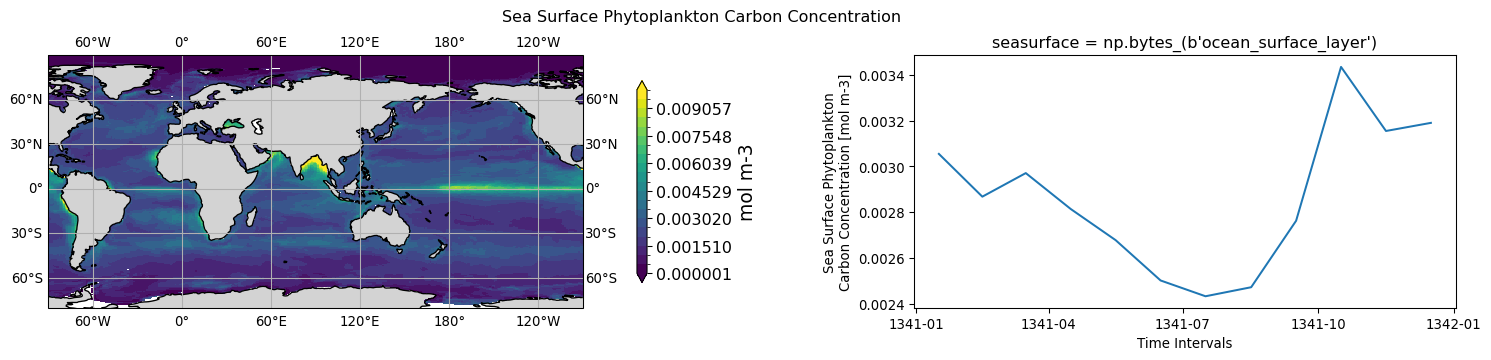
ocnBgchem.phyc.tavg-ols-hxy-sea.mon.glb
long name: Sea Surface Phytoplankton Carbon Concentration (mol m-3)
timeseries aggregation method for 2D->1D plot: mean
original_name: srfphyc -> phyc
history: phyc = srfphyc*122 2026-08-03T15:25:26Z altered by CMOR: Treated scalar dimension: 'seasurface'.
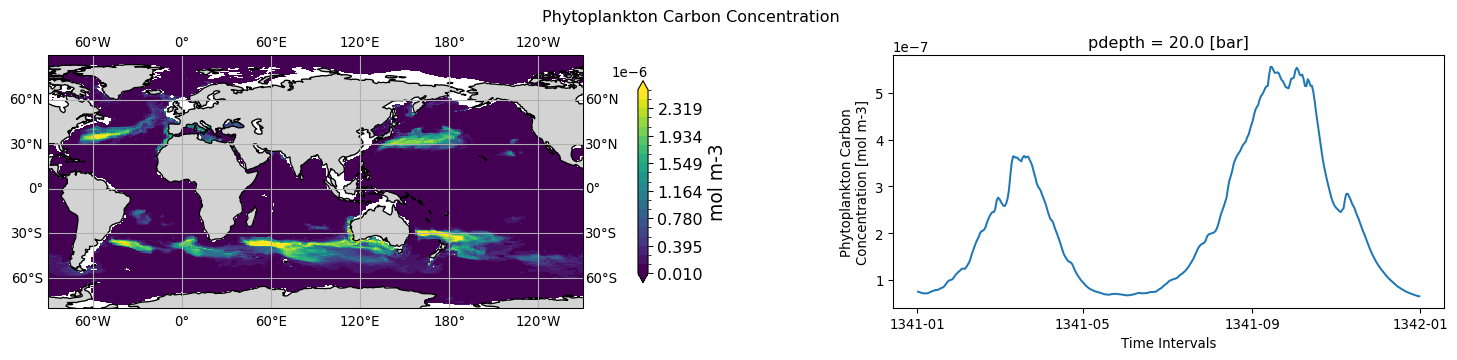
ocnBgchem.phyc.tavg-op20bar-hxy-sea.day.glb
long name: Phytoplankton Carbon Concentration (mol m-3)
timeseries aggregation method for 2D->1D plot: mean
original_name: phyc_200 -> phyc
history: 2026-08-03T15:25:27Z altered by CMOR: Treated scalar dimension: 'pdepth'.
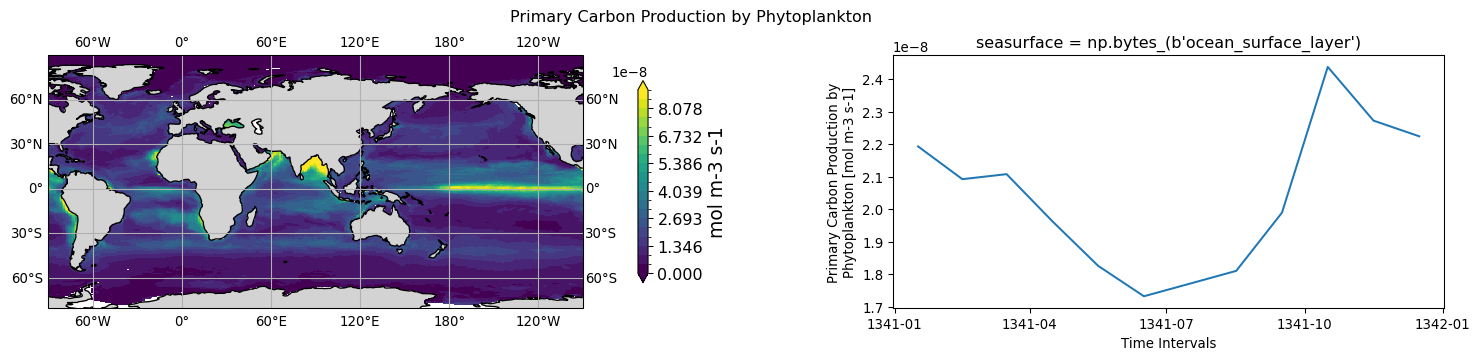
ocnBgchem.pp.tavg-ols-hxy-sea.mon.glb
long name: Primary Carbon Production by Phytoplankton (mol m-3 s-1)
timeseries aggregation method for 2D->1D plot: mean
original_name: pplvl -> pp
history: pp = pplvl[:,:,1] 2026-08-03T15:25:41Z altered by CMOR: Treated scalar dimension: 'seasurface'.
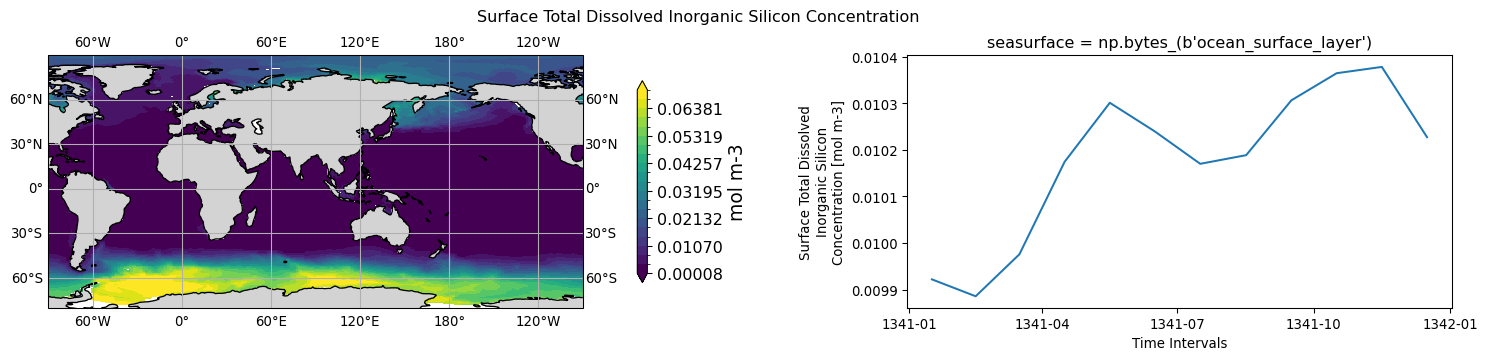
ocnBgchem.si.tavg-ols-hxy-sea.mon.glb
long name: Surface Total Dissolved Inorganic Silicon Concentration (mol m-3)
timeseries aggregation method for 2D->1D plot: mean
original_name: srfsi -> si
history: 2026-08-03T15:25:44Z altered by CMOR: Treated scalar dimension: 'seasurface'.
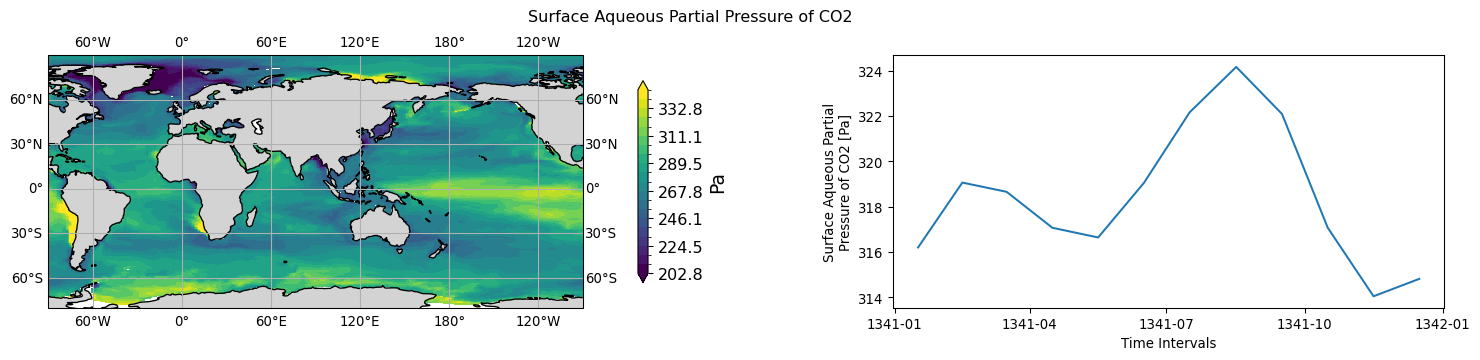
ocnBgchem.spco2.tavg-u-hxy-sea.mon.glb
long name: Surface Aqueous Partial Pressure of CO2 (Pa)
timeseries aggregation method for 2D->1D plot: mean
original_name: pco2 -> spco2
history: spco2 = pco2*muatm2pa
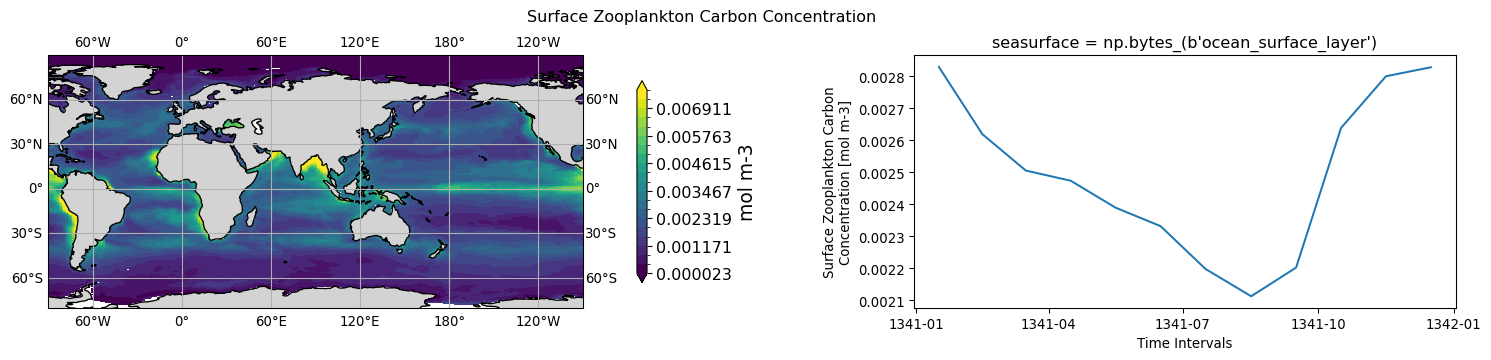
ocnBgchem.zooc.tavg-ols-hxy-sea.mon.30S-90S
long name: Surface Zooplankton Carbon Concentration (mol m-3)
timeseries aggregation method for 2D->1D plot: mean
original_name: zooclvl -> zooc
history: zooc = zooclvl[:,:,1]*122 2026-08-03T15:25:44Z altered by CMOR: Treated scalar dimension: 'seasurface'.