import numpy as np
import matplotlib.pyplot as plt
from matplotlib.colors import BoundaryNorm, ListedColormap

# Generate sample data: a 2D array of integers representing discrete categories
np.random.seed(42)
# Create a 10x10 grid with random integer values from 0 to 3
data = np.random.randint(0, 4, size=(10, 10))

# Define the discrete levels (boundaries) and the corresponding colors
levels = [0, 1, 2, 3, 4]          # boundaries: data in [0,1), [1,2), [2,3), [3,4)
n_levels = len(levels) - 1        # number of discrete categories

# Choose a qualitative colormap with exactly n_levels distinct colors
# Option 1: Use a built-in colormap with a limited number of colors
# colors = plt.cm.viridis(np.linspace(0, 1, n_levels))
# Option 2: Define custom colors (e.g., red, green, blue, magenta)
custom_colors = ['#e41a1c', '#4daf4a', '#377eb8', '#984ea3']
cmap = ListedColormap(custom_colors)

# Create a BoundaryNorm to map data to discrete color indices
norm = BoundaryNorm(levels, ncolors=len(cmap.colors), clip=False)

# Create the plot
fig, ax = plt.subplots(figsize=(8, 6))
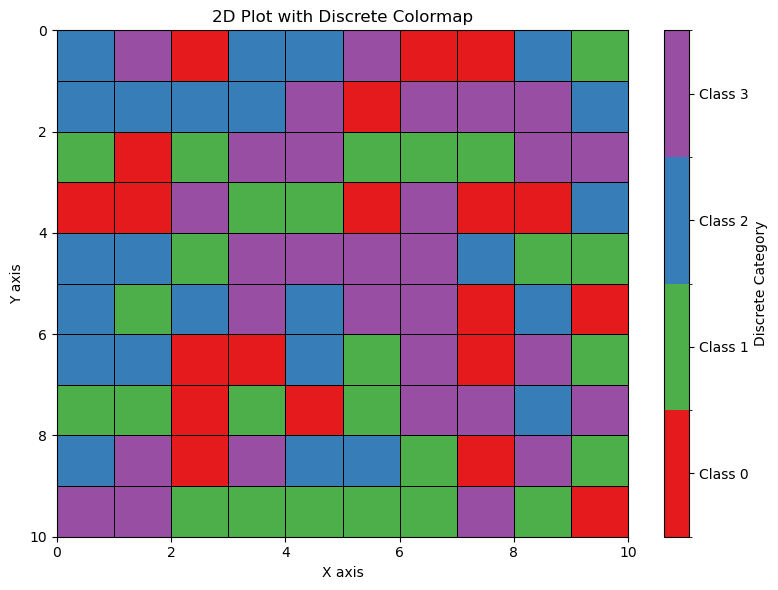
mesh = ax.pcolormesh(data, cmap=cmap, norm=norm, edgecolors='k', linewidth=0.5)

# Add a colorbar showing the discrete intervals
cbar = plt.colorbar(mesh, ax=ax, ticks=[0.5, 1.5, 2.5, 3.5])
cbar.set_ticklabels(['Class 0', 'Class 1', 'Class 2', 'Class 3'])
cbar.set_label('Discrete Category')

# Add labels and title
ax.set_xlabel('X axis')
ax.set_ylabel('Y axis')
ax.set_title('2D Plot with Discrete Colormap')

# Optionally, invert Y axis to match matrix indexing (optional)
ax.invert_yaxis()

plt.tight_layout()
plt.show()